Post WWII — 2025: Insights into fiscal and monetary policies, debt crisis, and more.
// Tools used: ChatGPT 4o, ChatGPT Deep Research.
Me: Break down this image, its content. Summarize it.
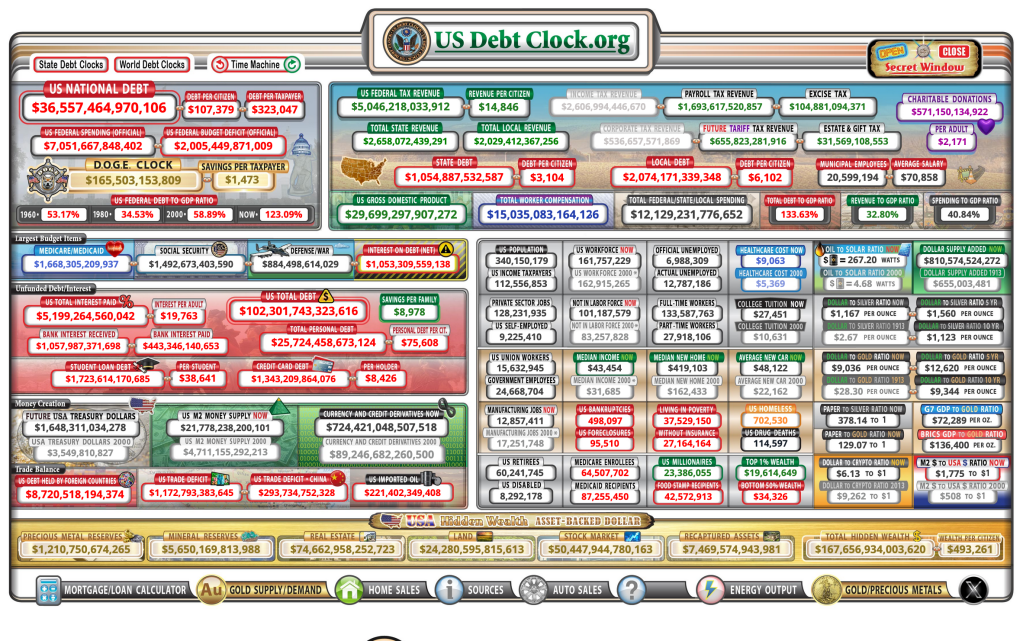
ChatGPT: This image is a screenshot of the U.S. Debt Clock website, which displays real-time financial statistics related to the U.S. economy, government debt, taxation, spending, and other macroeconomic indicators. The layout consists of multiple data points presented in a color-coded grid with figures updating dynamically.
Key Sections and Breakdown:
U.S. National Debt (Top Left — Red Box)
- The U.S. national debt is displayed prominently at $36.55 trillion.
- Debt per citizen: $107,379
- Debt per taxpayer: $323,047
- U.S. federal budget deficit: $2.005 trillion
- U.S. spending vs. revenue shows a significant shortfall, indicating fiscal imbalance.
Tax Revenue and Government Spending (Top Center & Right)
- U.S. federal tax revenue: $5.04 trillion
- Revenue per citizen: $14,846
- Total federal/state/local spending: $12.12 trillion
- Spending to GDP ratio: 40.84%
- Revenue to GDP ratio: 32.80%
- Total state debt: $1.05 trillion
- Total local debt: $2.07 trillion
Unfunded Liabilities & Interest on Debt (Bottom Left)
- Total U.S. debt (including personal, corporate, and government liabilities): $102.3 trillion
- Interest paid on debt: $1.05 trillion per year
- Total unfunded liabilities (Medicare, Social Security, etc.): $195.2 trillion
- Bank interest received: $1.05 trillion
- Student loan debt: $1.72 trillion
- Credit card debt: $1.34 trillion
U.S. Economic Indicators (Center)
- U.S. GDP (Gross Domestic Product): $29.69 trillion
- Total worker compensation: $15.03 trillion
- Median home price now: $416,433
- Average new car price: $48,122
- College tuition now: $27,451
- Healthcare cost per person: $9,063
Poverty, Unemployment, and Wealth Distribution (Bottom Right)
- People living in poverty: 37.52 million
- Homeless population: 377,529
- Food stamp recipients: 19.6 million
- Bottom 50% wealth: $34,326
- U.S. millionaires: 22.57 million
Trade and Currency Supply (Bottom)
- Trade deficit: $1.17 trillion
- Total U.S. money supply (M2): $21.77 trillion
- U.S. dollar supply vs. gold ratio: Drastic increase
- Dollar-to-gold and dollar-to-silver ratios show inflationary pressure on fiat currency.
Precious Metals, Energy, and Miscellaneous Indicators (Bottom Section)
- Gold & silver reserves: $1.21 trillion in precious metals
- Mineral reserves: $5.65 trillion
- Stock market capitalization: $50.44 trillion
- “Hidden Wealth” assets and recaptured assets section indicates alternative financial measures.
Summary of the Image’s Message:
The U.S. Debt Clock provides a detailed, real-time snapshot of the American financial system, highlighting rising government debt, unfunded liabilities, fiscal deficits, economic inequality, and monetary expansion. It emphasizes the unsustainable trajectory of government borrowing, debt interest payments, and social program obligations while juxtaposing it against GDP, tax revenue, and trade imbalances. The inclusion of precious metals, dollar devaluation statistics, and alternative wealth measurements suggests a concern over currency stability and long-term economic sustainability.
Me: What stands out to you, and based on economic history or currently other countries, or countries that have defaulted on their debt or went bankrupt, what can you tell me about the current trajectory of the US?
ChatGPT: What Stands Out in the U.S. Debt Clock?
Several alarming trends emerge from the U.S. Debt Clock that point toward long-term fiscal instability, rising debt burdens, and an unsustainable financial trajectory.
- $36.5 Trillion National Debt — This is an astronomical figure, and the pace of debt accumulation is accelerating.
- Debt-to-GDP Ratio: 123.09% — Historically, when countries exceed a 100% debt-to-GDP ratio, economic strains intensify. The U.S. is already deep into this territory.
- Annual Interest on Debt: $1.05 Trillion — The U.S. now spends over $1 trillion annually just to service its debt — an amount greater than the defense budget.
- Personal Debt per Citizen: $75,608 — Americans are carrying enormous levels of personal debt, which adds economic fragility.
- Social Programs & Unfunded Liabilities: $195 Trillion — The future costs of Social Security, Medicare, and other obligations far exceed government revenues.
These figures paint a concerning picture of growing debt, rising interest payments, and an increasingly unmanageable fiscal burden. The U.S. is currently financing its debt through continuous borrowing and money printing, which historically has led other nations into severe crises.
What Economic History Tells Us About the U.S. Trajectory
Lessons from Countries That Defaulted or Went Bankrupt
Throughout history, nations have gone bankrupt or faced debt crises when they followed similar economic patterns. The key question is: How does the U.S. compare to past cases of national economic collapse?
1. Argentina (Repeated Defaults & Hyperinflation)
- Debt-fueled spending, political mismanagement, and currency devaluation led Argentina into multiple debt crises.
- Defaulted in 2001, 2014, and 2020 — The government could no longer pay its obligations.
- Hyperinflation and economic stagnation led to mass poverty and capital flight.
🔎 Parallels to the U.S.:
- The U.S. is borrowing heavily to fund social programs and military spending, much like Argentina did.
- If interest payments spiral out of control, the U.S. could face a situation where new debt issuance is needed just to pay off old debt — an economic death spiral.
2. Greece (2009 Debt Crisis)
- Greece ran large fiscal deficits for years, borrowing excessively while using a currency (the Euro) that it couldn’t print.
- By 2010, debt-to-GDP surpassed 140%, and lenders demanded austerity measures in exchange for bailout funds.
- Unemployment soared, pensions were slashed, and the economy entered a deep depression.
🔎 Parallels to the U.S.:
- The U.S. can print dollars, unlike Greece, but excessive monetary expansion can still lead to inflationary collapse.
- U.S. debt-to-GDP ratio is already approaching Greek crisis levels.
- If trust in Treasury bonds declines, interest rates will rise, making debt service impossible without severe spending cuts.
3. The Weimar Republic (Germany, 1920s Hyperinflation)
- Printing money to pay war debts led to hyperinflation.
- German currency became worthless as confidence collapsed.
- The government was forced to introduce a new currency after total economic breakdown.
🔎 Parallels to the U.S.:
- The U.S. Federal Reserve is monetizing debt (buying Treasury bonds to keep the government solvent).
- Dollar devaluation is already occurring, as seen in rising asset prices (stocks, real estate, and commodities).
- If inflation spirals out of control, faith in the dollar could collapse, requiring drastic monetary reforms.
4. Japan (The Debt Trap with No Growth)
- Japan has the highest debt-to-GDP ratio (260%) but has avoided collapse through:
- Low interest rates (near zero)
- A closed economy with strong domestic savings
- No external dependency on foreign lenders
- However, Japan’s economy has stagnated for 30+ years due to a debt-driven growth model that no longer produces returns.
🔎 Parallels to the U.S.:
- The U.S. is also relying on artificially low interest rates to sustain its debt.
- If economic stagnation sets in, the U.S. could enter a Japan-style trap where debt grows but GDP does not.
- However, the U.S. differs in that it relies on foreign lenders (China, Japan, Gulf states, etc.), making it vulnerable to external shocks.
Where Is the U.S. Heading?
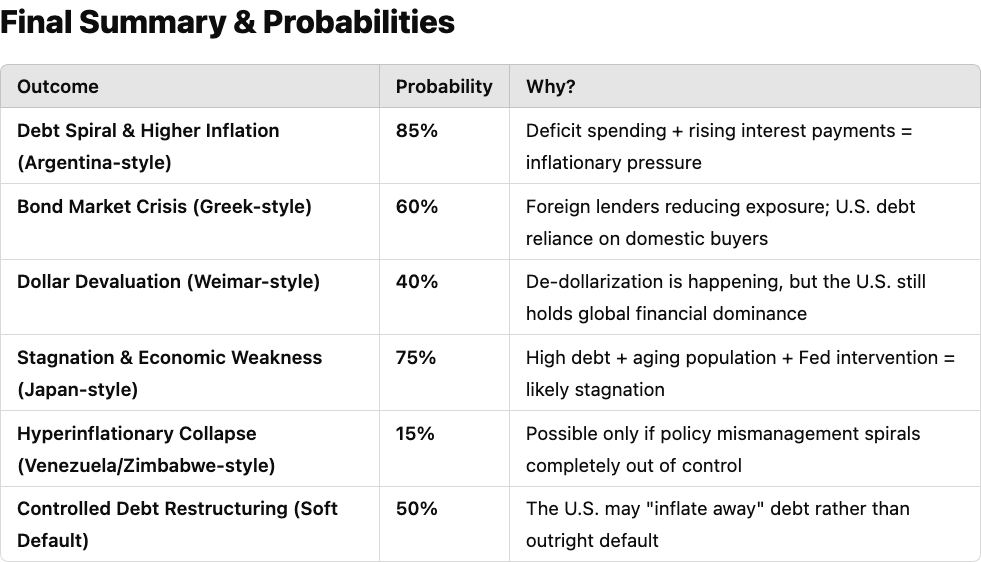
Based on these historical case studies, the U.S. appears to be on a trajectory that combines elements of Argentina, Greece, the Weimar Republic, and Japan. The most likely outcomes are:
Debt Spiral & Higher Inflation (Argentina-style)
- If the government keeps borrowing and the Fed keeps printing money, inflation could rise further.
- U.S. citizens may see higher prices, eroded wages, and declining purchasing power.
Bond Market Crisis (Greek-style)
- If foreign buyers (China, Japan, Gulf nations) stop buying U.S. Treasuries, the U.S. may struggle to finance its debt.
- Interest rates would rise sharply, triggering a financial crisis.
Dollar Devaluation (Weimar-style)
- The U.S. may be forced to devalue the dollar to make debt manageable.
- This would cause massive inflation and a loss of global confidence in the dollar.
Stagnation & Long-Term Economic Weakness (Japan-style)
- The U.S. could face years of low growth, high debt, and policy paralysis.
- Economic dynamism would be stifled as the government struggles to service debt.
What Could Prevent a U.S. Collapse?
The main advantage the U.S. has is that the dollar is the world’s reserve currency — meaning it can keep borrowing longer than most nations. However, there are limits to how long this can last.
To avoid collapse, the U.S. would need to:
- Reduce spending or raise taxes (politically unpopular but necessary).
- Increase economic productivity (through innovation, industry growth, or deregulation).
- Control monetary expansion (prevent excessive money printing).
- Maintain global confidence in the dollar (otherwise, countries will seek alternatives like BRICS currencies, gold, or crypto).
If the U.S. fails to address these issues, it risks a multi-phase economic crisis:
- Bond market stress (rising interest rates)
- Inflationary crisis (loss of purchasing power)
- Debt restructuring or devaluation (economic shock)
- Long-term stagnation (declining economic power)
Final Thoughts: Is the U.S. on an Inevitable Path to Collapse?
While outright collapse is not immediate, the U.S. is following dangerous economic patterns seen in failed states and debt-ridden nations. The key warning signs — rising debt, massive interest payments, over-reliance on the Fed, and declining purchasing power — are all flashing red.
- If deficit spending continues unchecked, inflation will rise.
- If interest payments overwhelm the budget, the U.S. may have to choose between defaulting, inflating, or drastically cutting spending.
- If foreign confidence in U.S. bonds collapses, a full-blown crisis could unfold.
While the U.S. is not Argentina, Greece, or Weimar Germany yet, history suggests that no empire can maintain endless debt and monetary manipulation forever. Without major reforms, the trajectory is not sustainable.
Me: For the most likely outcomes, if needed, add more, but put a probability 1–100% of the likelihood of each outcome, an reasons why.
ChatGPT: Probability of Each Economic Outcome for the U.S. & Reasons Why
1. Debt Spiral & Higher Inflation (Argentina-style)
Probability: 85% (Very Likely)
✅ Why this is likely:
- Government spending is outpacing revenue at an accelerating rate. The U.S. federal budget deficit is already over $2 trillion per year, and deficit spending shows no signs of slowing.
- Interest on debt is compounding. The U.S. is now paying $1.05 trillion per year in interest alone, which is expected to surpass military spending in the next few years.
- Federal Reserve policies encourage inflation. The Fed has already engaged in Quantitative Easing (QE) multiple times and may be forced to print more money to cover future deficits.
- Debt-to-GDP ratio is unsustainable. The U.S. is at 123% debt-to-GDP, and historically, countries above 100% struggle to grow out of debt without inflation.
- Inflation is persistent. Even with interest rate hikes, the structural factors (wage increases, supply chain issues, and global de-dollarization) are making it hard to return to the 2% inflation target.
⚠ Potential mitigation:
- Cutting spending and reducing government programs could help, but this is politically unpopular.
- Raising taxes on the wealthy and corporations could slow debt growth but would be met with fierce resistance.
- If the U.S. government can increase productivity and GDP growth, it may outgrow some debt, but the trajectory suggests inflation will remain high.
2. Bond Market Crisis (Greek-style)
Probability: 60% (Moderately Likely, But Not Immediate)
✅ Why this could happen:
- Foreign investors are reducing their exposure to U.S. debt. China, once one of the largest buyers of U.S. Treasuries, has been steadily reducing its holdings over the last decade.
- The U.S. is becoming increasingly reliant on domestic buyers (banks, pensions, the Fed). If institutional investors lose faith in Treasuries due to inflation, they may demand higher interest rates or refuse to buy new debt.
- If interest rates rise too high, debt service will become unsustainable. The government will struggle to refinance debt, leading to a potential default or forced restructuring.
⚠ Potential mitigation:
- As long as the U.S. dollar remains the global reserve currency, there will still be demand for Treasuries.
- If the Federal Reserve resumes bond-buying programs (QE), it could artificially suppress yields, but this would exacerbate inflation.
- The U.S. might impose capital controls or financial repression to prevent capital flight.
3. Dollar Devaluation (Weimar-style)
Probability: 40% (Possible but Not Inevitable)
✅ Why this could happen:
- The dollar has already lost purchasing power. Since 1971 (when the U.S. abandoned the gold standard), the dollar has lost over 85% of its value in real terms.
- If inflation accelerates and debt monetization increases, confidence in the dollar could erode further. Countries like Russia, China, and BRICS nations are already exploring alternatives to the dollar.
- If a major geopolitical event shakes trust in the U.S., foreign countries may dump the dollar. This would cause a rapid devaluation, leading to hyperinflation-like conditions.
⚠ Potential mitigation:
- As long as the U.S. controls key global financial institutions (IMF, SWIFT, Federal Reserve influence), it can slow de-dollarization.
- The U.S. military’s dominance acts as a backstop for the dollar, ensuring other nations remain dependent on it.
- The U.S. could introduce a new monetary system, possibly backed by digital assets or commodities, to restore confidence.
4. Stagnation & Long-Term Economic Weakness (Japan-style)
Probability: 75% (Highly Likely if No Policy Change)
✅ Why this is likely:
- The U.S. economy is heavily financialized. Just like Japan, much of its economic activity is tied to financial markets, rather than productive industry.
- The U.S. has an aging population. Social Security and Medicare obligations will balloon, requiring either higher taxes, more borrowing, or reduced benefits.
- Debt levels may force the Fed to keep rates low, leading to “zombie companies” and economic stagnation. Japan has been stuck in a low-growth cycle for 30+ years because it refused to allow its economy to reset.
⚠ Potential mitigation:
- The U.S. can avoid stagnation if it focuses on technological innovation, AI, automation, and energy independence.
- Immigration reform could provide a younger workforce to counteract demographic decline.
- If the government redirects spending to infrastructure and industrial growth, it could stimulate real economic expansion.
Additional Possible Outcomes
5. Hyperinflationary Collapse (Venezuela/Zimbabwe-style)
Probability: 15% (Unlikely, but Possible in a Worst-Case Scenario)
✅ Why this could happen:
- If the government completely loses control of fiscal policy and the Federal Reserve engages in unlimited money printing, the U.S. could enter a hyperinflationary spiral.
- If foreign nations abandon the dollar en masse, the U.S. might be forced to print extreme amounts of money to cover deficits.
⚠ Why this is unlikely:
- The U.S. economy is much more diversified and resilient than Venezuela or Zimbabwe.
- The U.S. has stronger global trade agreements, energy reserves, and military power, making a total collapse less probable.
6. A Controlled Debt Restructuring (Soft Default)
Probability: 50% (Even Chance Depending on Policy Decisions)
✅ Why this could happen:
- If debt becomes too large to service, the government may negotiate a “soft default”. This could involve:
- Extending bond maturities (paying later)
- Offering lower interest rates on existing debt
- Printing money to pay down obligations in a controlled manner
- This would be similar to what happened in the 1940s, when the U.S. had a massive debt burden post-WWII but was able to inflate it away gradually.
⚠ Why this is a real possibility:
- The Fed and Treasury may work together to devalue debt gradually through moderate inflation.
- A formal default is unlikely, but a “stealth default” via currency devaluation or restructuring could happen.
Most Likely Scenario:
- The U.S. enters a Japan-like stagnation with high inflation (stagflation).
- A bond market crisis could force debt restructuring.
- The dollar may weaken gradually, but outright hyperinflation is less likely unless debt monetization spirals further.
- Inflation remains persistent, leading to an erosion of living standards (similar to Argentina).
Biggest Wildcard:
- If the U.S. loses global confidence in its currency due to geopolitical shifts (BRICS, war, resource shortages), the risk of a major financial shock increases.
🚨 Bottom Line: Without major reforms, the U.S. is on track for either a slow decline (Japan-style) or a high-inflation debt spiral (Argentina-style). A major financial crisis within the next 10–20 years is highly probable.
Me: Who else, or notable figures, have talked about the trajectory or debt spiral the US is headed?
ChatGPT: <contemplator> Hmm, let’s delve into the perspectives of notable figures regarding the U.S. debt trajectory. Ray Dalio, founder of Bridgewater Associates, has been vocal about his concerns. He warns that the U.S. could face a severe debt crisis within the next three years if fiscal deficits aren’t addressed. He likens fiscal deficits to “plaque” in the economic system, suggesting a potential “heart attack”
Former President Donald Trump has proposed unconventional strategies to tackle the mounting U.S. debt, which has reached $36 trillion. His administration is exploring ideas like forcing foreign governments to swap Treasuries for cheaper bonds and selling residency cards to wealthy foreigners. However, investors remain skeptical about the effectiveness of these measures. reuters.com
Mary Meeker, a renowned Wall Street analyst-turned-investor, has also raised alarms about America’s financial state. She highlights significant structural weaknesses threatening the country’s global standing, noting that interest payments are consuming a growing portion of government revenue. axios.com
Additionally, former U.S. Comptroller General David M. Walker has compared the current U.S. situation to the decline of the Roman Empire. He warns of unsustainable policies, swelling Medicare and Social Security costs, and extensive military commitments, all of which could lead to a crisis if not addressed promptly. en.wikipedia.org
These perspectives highlight a growing concern among financial experts and policymakers about the sustainability of the U.S. debt trajectory. The consensus suggests that without significant fiscal reforms, the nation could face severe economic challenges in the near future. </contemplator>
Part II: ChatGPT Deep Research
Me: Do an in-depth analysis or report on how the US got into this financial situation. Include all of its economic history, policies, spending, financial crisis, bailouts, QE, QT, etc.
ChatGPT: To provide a thorough in-depth analysis of how the U.S. got into its current financial situation, could you clarify the preferred scope and depth of coverage? Specifically:
Timeframe — Should the analysis start from the founding of the U.S., or focus on modern financial history (e.g., post-World War II, post-1971 when the gold standard ended, or the 2008 financial crisis onward)?
Key Focus Areas — Do you want a broad economic history, or should we emphasize specific aspects such as:
- Government fiscal policy (taxation, spending trends, entitlement programs)
- Monetary policy (Federal Reserve actions, QE, QT, interest rates)
- Major financial crises and their long-term effects
- The role of debt in military, infrastructure, and social programs
Comparisons — Would you like comparisons with other historical economic collapses or countries that have experienced similar trajectories?
Policy Evaluations — Should we include potential policy solutions that have been proposed to address the crisis?
This will help ensure the report is as detailed and tailored to your interests as possible.
Me: Timeframe: Post WWII, Key Focus Area: broad economic history, each role; Comparisons: Other historical economic collapses; Policy Evaluations: Yes include solutions.
ChatGPT: Understood! I will conduct an in-depth analysis of how the U.S. got into its current financial situation, starting from the post-World War II era. This will cover broad economic history, including fiscal policies, monetary policy decisions, major financial crises, and the role of debt in military, infrastructure, and social programs. Additionally, I will compare the U.S. trajectory with other historical economic collapses and include policy evaluations with potential solutions.
I’ll let you know once the detailed report is ready.
// 9 minutes 50 sources.
ChatGPT:
How the U.S. Got Into Its Current Financial Situation (Post-WWII to Today)
Understood! I will conduct an in-depth analysis of how the U.S. got into its current financial situation, starting from the post-World War II era. This will cover broad economic history, including fiscal policies, monetary policy decisions, major financial crises, and the role of debt in military, infrastructure, and social programs. Additionally, I will compare the U.S. trajectory with other historical economic collapses and include policy evaluations with potential solutions.
I’ll let you know once the detailed report is ready.
How the U.S. Got Into Its Current Financial Situation (Post-WWII to Today)
Broad Economic History (1945–Present)
The United States emerged from World War II as an economic superpower, producing over half of the world’s manufactured goods by 1945 (Great Responsibilities and New Global Power | The National WWII Museum | New Orleans). In the post-war boom of the 1950s and 1960s, U.S. GDP surged from $228 billion in 1945 to nearly $1.7 trillion by 1975 (Post–World War II economic expansion — Wikipedia). This “Golden Age” saw rapid industrial growth, low unemployment, and the rise of a prosperous middle class. Government policies (like the GI Bill and highway construction) and pent-up consumer demand fueled growth, while the Bretton Woods system fixed global exchange rates, anchoring the dollar’s value in gold. By the early 1970s the U.S. economy accounted for roughly 35% of world output (Post–World War II economic expansion — Wikipedia), but cracks were forming as foreign competition increased and inflationary pressures grew.
Starting in the 1970s, U.S. economic momentum slowed. The stagflation era brought simultaneous stagnant growth and high inflation, marking an end to the post-war expansion. Oil shocks in 1973 and 1979, combined with deficit spending on the Vietnam War and social programs, led to double-digit inflation (peaking above 14% in 1980) (The Great Inflation | Federal Reserve History) and multiple recessions. In response, a policy shift occurred in the 1980s under President Ronald Reagan: taxes were cut and industries deregulated to spur growth, even as military spending rose. The economy rebounded in the 1980s but at the cost of higher public debt (as discussed later). The 1990s saw another pivot — the tech boom and globalization. Rapid innovation (e.g. the internet) and expanded trade (NAFTA and engagement with China) boosted growth and government revenues. By 1998 the U.S. achieved budget surpluses for four straight years — the first such streak in 40 years (The U.S. National Debt Dilemma | Council on Foreign Relations). However, the dot-com stock bubble burst in 2000, leading to a mild recession.
In the 2000s and 2010s, the U.S. economy faced new challenges. After the 2001 recession, the Federal Reserve cut interest rates to historically low levels, helping fuel a housing and credit boom. This culminated in the 2008 financial crisis (covered later) that caused the worst downturn since the 1930s. The recovery in the 2010s was long but slow (The Great Recession and Its Aftermath | Federal Reserve History), characterized by low inflation and interest rates — a period often called the “new normal” or “secular stagnation” for its modest growth. By the end of the 2010s, unemployment hit 50-year lows and stock markets reached record highs, but underlying issues like rising federal debt and wealth inequality persisted. In 2020, the COVID-19 pandemic abruptly disrupted the economy, causing a sharp but brief recession. Massive stimulus spending and easy monetary policy helped spur a rapid rebound, but also contributed to the highest inflation in 40 years by 2021–2022. Today, the U.S. finds itself with slower growth, high inflation pressures, and record debt — a culmination of decades of economic trends and policy choices.
Role of Fiscal Policy (Taxes, Spending, Deficits)
U.S. fiscal policy since WWII has swung between periods of discipline and expansion. In the immediate post-war decades, high tax rates on top incomes (over 90% in the 1950s) and restrained spending helped reduce the federal debt ratio dramatically. Despite funding the Korean and Vietnam Wars and launching major entitlement programs (Medicare and Medicaid in 1965), rapid economic growth kept annual deficits modest. Federal debt fell from about 100% of GDP in 1945 to just 24% of GDP by 1974 (The U.S. National Debt Dilemma | Council on Foreign Relations). This decline occurred even as programs like Social Security expanded and defense spending remained elevated in the Cold War (The U.S. National Debt Dilemma | Council on Foreign Relations). In the late 1960s, however, the combination of Great Society social programs and Vietnam War costs pushed deficits higher, contributing to inflation. President Nixon in 1971 even ended the dollar’s gold convertibility (the end of Bretton Woods), allowing the currency to float — a fiscal and monetary watershed that effectively let the U.S. print money to finance spending (How the Great Inflation of the 1970s Happened).
Starting in the 1980s, fiscal policy took a decidedly expansionary turn. The Reagan administration enacted large tax cuts (the 1981 Economic Recovery Tax Act) while sharply increasing defense spending. The result was a surge in budget deficits — the annual deficit exceeded 5% of GDP in the mid-1980s — and the national debt tripled in nominal terms over the decade (The U.S. National Debt Dilemma | Council on Foreign Relations). These “Reagan deficits” reversed the post-war debt decline and ushered in a new period of rising debt. In the 1990s, a bipartisan effort of tax increases and spending restraint (including 1990 and 1993 deficit reduction deals) coincided with a booming economy. Together, they shrank the deficit and eventually produced a budget surplus by the late 1990s (The U.S. National Debt Dilemma | Council on Foreign Relations). Notably, the end of the Cold War allowed defense cuts, and strong growth boosted tax revenues (especially from capital gains in the tech stock boom).
The early 2000s saw a return to deficit spending. The Bush administration enacted major tax cuts in 2001 and 2003, began long and costly wars in Afghanistan and Iraq, and expanded Medicare to include prescription drugs (Medicare Part D) (The U.S. National Debt Dilemma | Council on Foreign Relations). These policies turned surpluses back into deficits. By 2004, the deficit was around 3.5% of GDP, and it ballooned further with the Great Recession of 2008–2009. In response to the crisis, fiscal policy became highly stimulative: President Obama continued the financial bailout programs started under Bush and passed a nearly $800 billion stimulus (ARRA) in 2009 (The U.S. National Debt Dilemma | Council on Foreign Relations). Deficits exceeded $1 trillion (the highest in postwar history to that point) in 2009–2011 (The U.S. National Debt Dilemma | Council on Foreign Relations). While they narrowed mid-decade, the Trump administration then passed the Tax Cuts and Jobs Act of 2017 — the largest tax overhaul in a generation — which the Congressional Budget Office (CBO) projected would add roughly $1.8 trillion to the debt over 10 years due to lost revenue (The U.S. National Debt Dilemma | Council on Foreign Relations). Indeed, government tax receipts fell to around 16–17% of GDP after the cuts, low by historical standards, even as spending continued to grow.
A major inflection point came with the COVID-19 pandemic. To counter the economic collapse in 2020, the U.S. government enacted trillions in emergency spending — including the $2.2 trillion CARES Act — sending relief checks, expanding unemployment benefits, and aiding businesses. As a result, the FY2020 budget deficit hit $3.1 trillion (about 15% of GDP) — by far the highest deficit-to-GDP since World War II (The U.S. National Debt Dilemma | Council on Foreign Relations). This one year added trillions to the national debt. Although revenues recovered in 2021–2022 and emergency programs lapsed, the U.S. is now left with a structural mismatch: spending (especially on entitlements) is outpacing revenues. Mandatory spending on programs like Social Security, Medicare, and Medicaid automatically grows with an aging population and rising healthcare costs, and these programs now constitute the majority of federal outlays (The U.S. National Debt Dilemma | Council on Foreign Relations) (The U.S. National Debt Dilemma | Council on Foreign Relations). Meanwhile, political constraints make significant tax increases difficult — over 80% of Congressional Republicans have pledged never to raise taxes (The U.S. National Debt Dilemma | Council on Foreign Relations). The result is persistent deficit financing. The government has run a budget deficit in 36 of the past 40 years, and each deficit adds to the debt. In short, decades of tax cuts not fully offset by spending cuts (or vice versa) — combined with economic downturns that prompted heavy stimulus — have put the U.S. on an unsustainable fiscal path. The national debt is now over $33 trillion, reflecting the cumulative effect of long-term entitlement growth, military expenditures, and repeated deficit spending.
Monetary Policy Decisions (Fed Actions, Interest Rates, QE/QT)
Monetary policy — controlled by the Federal Reserve — has played a pivotal role in U.S. financial history since WWII. In the immediate post-war decades, the Fed generally supported the Keynesian goal of full employment, keeping interest rates relatively low. The dollar’s value was fixed to gold ($35/oz) under Bretton Woods, which helped anchor inflation in the 1950s and early 1960s. However, by the late 1960s, inflation started creeping up (above 5%) due to loose monetary policy coupled with fiscal expansion. In the 1970s, the Fed (under chairs Arthur Burns and G. William Miller) was often seen as behind the curve on inflation. Under political pressure (President Nixon famously told Burns, “we’ll take inflation if necessary, but we can’t take unemployment” (How the Great Inflation of the 1970s Happened) (How the Great Inflation of the 1970s Happened)), the Fed kept interest rates too low for too long. This contributed to the Great Inflation: consumer prices ratcheted upwards, reaching more than 14% annual inflation in 1980 (The Great Inflation | Federal Reserve History). At the same time, the collapse of the Bretton Woods system in 1971 allowed the dollar to float, and a flood of dollars (from deficits and Fed money growth) led to a weaker currency and higher import prices (Stagflation in the 1970s). The Fed’s missteps in this era taught hard lessons: by 1979, inflation expectations were deeply entrenched and confidence in the Fed’s credibility was lost (Stagflation in the 1970s).
A turning point came with Fed Chairman Paul Volcker (1979–1987). Confronted with runaway inflation, Volcker dramatically raised interest rates — the federal funds rate was pushed above 19% at its peak. This “Volcker shock” triggered a severe recession (1981–82) but succeeded in breaking the back of inflation. By 1983, inflation fell below 3% (Paul Volcker — Wikipedia). The Volcker era established price stability as the Fed’s primary objective. In subsequent decades, the Fed under Alan Greenspan (1987–2006) generally maintained moderate interest rates and low inflation, a period dubbed the “Great Moderation.” However, Greenspan’s Fed also took unprecedented actions to counter crises: after the 1987 stock market crash (when the Dow plunged 22% in a day), the Fed intervened to supply liquidity and reassure markets. Likewise, during the late 1990s Asian and Russian financial crises and the Long-Term Capital Management hedge fund collapse (1998), the Fed eased policy to contain contagion. These responses cultivated the notion of a “Fed put”, meaning investors believed the Fed would rescue markets during turmoil. While effective in the short run, some argue this encouraged excessive risk-taking over time.
Monetary policy became even more central after the 2008 financial crisis. With the economy in freefall, the Fed under Ben Bernanke slashed interest rates to near 0% by December 2008. Because it could not cut rates further (the zero lower bound), the Fed turned to unconventional tools — most notably Quantitative Easing (QE). Through QE, the Fed purchased trillions of dollars in Treasury and mortgage-backed securities to inject liquidity and lower long-term interest rates. Between 2008 and 2015, the Fed undertook three rounds of QE (QE1 in 2008–09, QE2 in 2010, QE3 in 2012–2014), which expanded its balance sheet over fourfold — from under $1 trillion to about $4.5 trillion by 2015 (). These asset purchases helped drive down borrowing costs for consumers and businesses, supporting the economic recovery. However, critics note that QE also inflated asset prices (stocks, real estate) and potentially laid ground for future inflation. The Fed attempted to normalize policy in the late 2010s: it raised the fed funds rate gradually from 2015–2018 and even began Quantitative Tightening (QT) in 2017, slowly reducing its bond holdings. But interest rates only reached around 2.5% before the Fed reversed course amid slowing growth in 2019.
In 2020, the pandemic once again pushed the Fed into uncharted territory. It swiftly cut rates back to 0% and launched a massive new round of QE (sometimes called “QE4”), buying Treasury bonds and other assets at an unprecedented pace. The Fed’s balance sheet ballooned from $4.7 trillion in early 2020 to nearly $7 trillion by mid-2020 and about $9 trillion at its peak in 2022 ( Lucas: Congress’ Attention to Monetary Policy is Crucial As We Know the Actions of the Fed Directly Impact the Economic Well-Being of All Americans | Financial Services Committee ). These actions, along with emergency lending facilities, stabilized financial markets and, combined with fiscal stimulus, fostered a rapid economic rebound. But they also greatly expanded the money supply. By 2021–2022, inflation surged well above the Fed’s 2% target, hitting ~7% in 2021 and over 9% by June 2022 (highest since 1981). The Fed, under Chair Jerome Powell, belatedly tightened policy. Starting in March 2022, it raised interest rates at the fastest pace since Volcker’s era, reaching about 5% by early 2023. It also began QT again, allowing bonds on its balance sheet to mature without reinvestment, which gradually shrinks the balance sheet. These moves have started to tame inflation, but at the cost of higher interest expenses for the government and volatility in interest-sensitive sectors (like banking and housing). In summary, Fed policy since WWII has oscillated between accommodative stances to fight unemployment or crises, and tightening cycles to control inflation. The current challenge is achieving price stability after the pandemic shock without causing a severe recession or financial instability — a delicate balance that will significantly impact the nation’s fiscal outlook (since higher rates dramatically increase the cost of servicing debt, as discussed below).
Major Financial Crises and Downturns
Throughout the post-war era, the U.S. has weathered several major economic crises that influenced its financial trajectory:
1970s Stagflation: (The Great Inflation | Federal Reserve History) A “Whip Inflation Now” button from President Ford’s 1974 anti-inflation campaign (WIN). In the 1970s the U.S. experienced a rare mix of high inflation, high unemployment, and slow growth. The 1973 Arab oil embargo quadrupled oil prices, fueling inflation and a deep recession (1973–75). Despite periodic growth, inflation remained stubborn; by 1979–1980, consumer prices were rising ~13%–14% annually (The Great Inflation | Federal Reserve History). Unemployment also climbed (reaching 9% in 1975 and 7.8% in 1980). This stagflation shocked economists who had assumed inflation and unemployment couldn’t soar together. It eroded living standards (real incomes stagnated) and shook confidence in U.S. economic management. The Federal Reserve’s aggressive rate hikes in 1980–82 eventually quelled stagflation at the cost of back-to-back recessions. The lessons of the 1970s — notably, the importance of controlling inflation expectations — have since guided U.S. policy. Stagflation also led to political change: it helped elect President Reagan, who promised a new approach to revive growth.
1987 Stock Market Crash: On October 19, 1987 (“Black Monday”), U.S. stock markets plunged ~22% in a single day. This crash did not originate from economic fundamentals but from a mix of investor panic and program trading. Fearing a financial meltdown, the Fed (under Greenspan) intervened swiftly, reassuring markets it stood ready to provide liquidity. Confidence was restored and a recession was averted. In fact, by 1988 the economy was growing briskly again. The 1987 crash was a brief financial shock, but its handling reinforced the perception that the Fed would cushion major market falls. Importantly, the crash did not inflict lasting damage on the federal budget or banking system — unlike other crises, it was largely confined to equity markets and quickly reversed.
Dot-Com Bubble (2000): The late 1990s saw a speculative frenzy in technology and internet-related stocks. The NASDAQ index rose 800% between 1995 and its peak in March 2000, then collapsed — falling 78% by October 2002 and wiping out trillions in market value (Dot-com bubble — Wikipedia). Many dot-com startups with no profits (or even revenues) went bust. The crash contributed to the 2001 recession (unemployment rose above 6% by 2003). Government finances also swung from surplus to deficit, partly because the bubble’s burst reduced capital gains tax receipts and led to stimulus measures. However, the dot-com crash’s overall impact was milder than other downturns: GDP dipped only slightly in 2001. The Federal Reserve cut interest rates aggressively (from ~6.5% in 2000 to just 1% by 2003), which helped spark a recovery. Unfortunately, those very low rates also sowed the seeds for the next crisis by encouraging a housing boom. The dot-com era underscored how asset bubbles can distort the economy: the late-90s boom had boosted federal revenues temporarily (creating illusions of long-term surplus), while the bust showed how quickly fortunes could reverse.
2008 Great Recession: The housing bubble of the mid-2000s burst in 2007, triggering a cascade of failures in the U.S. (and global) financial system. Banks and investors had become dangerously exposed to risky mortgage-backed securities and derivatives. When home prices fell and mortgage defaults spiked, major institutions faltered — Bear Stearns collapsed in March 2008 and, most dramatically, Lehman Brothers went bankrupt in September 2008. Credit markets froze and the economy plunged into a deep recession from Dec 2007 to June 2009 (The Great Recession and Its Aftermath | Federal Reserve History). U.S. GDP contracted by 4.3% and over 8 million jobs were lost, pushing unemployment to 10% by late 2009. Household wealth shrank massively (stock indices fell ~50% from 2007 peak to 2009 trough, and home prices fell ~30% on average). The federal response was enormous: Congress passed the $700 billion TARP bailout (discussed in the next section) to stabilize banks, and the Fed slashed rates to zero and provided extraordinary aid to the financial system (The Great Recession and Its Aftermath | Federal Reserve History). These measures helped prevent a potential depression. By mid-2009 the economy bottomed out (The Great Recession and Its Aftermath | Federal Reserve History), but the recovery was painfully slow — in many ways the aftermath lasted for years. The crisis had a profound fiscal effect: automatic stabilizers (like unemployment insurance) and stimulus spending caused deficits to skyrocket, and debt held by the public roughly doubled (from ~35% of GDP in 2007 to ~70% by 2012). Moreover, the crisis prompted new regulations (e.g. Dodd-Frank Act 2010) and a permanent change in Fed policy tools (the use of QE). The Great Recession’s legacy is still felt in today’s debt levels and monetary policy environment.
COVID-19 Pandemic (2020): The pandemic caused an unprecedented economic sudden stop. In March–April 2020, businesses were shuttered and tens of millions of workers were laid off virtually overnight. GDP contracted at an annualized rate of ~31% in Q2 2020, and unemployment spiked to 14.7% (the highest since the Great Depression). Federal debt and spending ballooned as policymakers rushed to prevent a total collapse. Trillions were spent on stimulus checks, small business loans (PPP), expanded healthcare spending, and more. This fiscal firehose drove the 2020 deficit to $3.1 trillion (≈15% of GDP) (The U.S. National Debt Dilemma | Council on Foreign Relations), and another ~$2.8 trillion deficit followed in 2021 (Larger Federal Deficits & Higher Interests Rates Point to the Need …). The Fed’s actions (zero rates, QE, emergency lending) were likewise on a massive scale. These efforts succeeded in jump-starting a rapid recovery — by 2021 growth had returned and unemployment fell below 5%. However, the side effects were significant: by 2022 inflation hit 40-year highs as demand (supercharged by stimulus) outstripped supply, and the national debt had leapt to record levels. The pandemic essentially traded higher debt for a quicker rebound. It also highlighted the U.S. government’s willingness to run very large deficits in an emergency and the Fed’s willingness to finance much of it indirectly. The “COVID crisis” thereby exacerbated the long-term debt trajectory and created new challenges (like how to withdraw stimulus without destabilizing the economy). In the years since, interest rates have risen sharply to contain inflation, which in turn has increased the cost of servicing the debt — a compounding issue we turn to next.
Bailouts and Government Interventions
During these crises, the U.S. government often intervened heavily in the economy, providing bailouts or stimulus to mitigate damage. While such interventions were deemed necessary to prevent immediate collapse, they often added significantly to the federal debt and set precedents for future aid:
TARP (2008–2010): The Troubled Asset Relief Program was the signature bailout of the 2008 financial crisis. Initially authorized at $700 billion in October 2008, TARP’s budget authority was later reduced to $475 billion by the Dodd-Frank Act of 2010 (Troubled Asset Relief Program (TARP) — Treasury Department). Under TARP, the U.S. Treasury injected capital into banks, insured AIG’s liabilities, and aided auto companies. Ultimately, not all the money was needed — about $426 billion was actually disbursed. As the financial system stabilized, most TARP investments were repaid with interest. In fact, by 2014, the government had recovered $441.7 billion on $426.4 billion invested, yielding a profit of $15.3 billion on TARP’s bank programs (Emergency Economic Stabilization Act of 2008 — Wikipedia). However, TARP was extremely controversial at the time — it symbolized the rescue of Wall Street at taxpayer expense. It also highlighted moral hazard: large financial institutions assumed (correctly) that the government would rescue them if their failure posed systemic risk. Beyond TARP, the Federal Reserve undertook its own rescue measures — providing emergency loans to banks and facilitating JPMorgan’s takeover of Bear Stearns — which were not direct fiscal outlays but did expose the government to risk. The auto industry bailout, closely associated with TARP, loaned about $80 billion to General Motors and Chrysler. While most of that was recovered when the companies returned to viability, the Treasury estimated a loss of about $10 billion on the auto rescue.
Housing Market Interventions: In the late 2000s, the government also put Fannie Mae and Freddie Mac (giant mortgage finance agencies) into conservatorship, essentially backstopping their ~$5 trillion in mortgage guarantees. This was not legislated as a “bailout” per se, but it implied that federal funds would cover their losses. Indeed, the Treasury provided about $191 billion to stabilize Fannie and Freddie in 2008–2011. These entities have since returned to profitability and pay dividends to Treasury, but they remain under government control. The federal government also expanded loan programs and guarantees to stem foreclosures during the Great Recession (e.g. HAMP and HARP programs to modify/refinance mortgages).
Stimulus Packages: Fiscal stimulus is another form of intervention. During recessions, the government has often increased spending or cut taxes to boost demand. Beyond the automatic stabilizers, discretionary stimulus bills have been passed in several crises. For example, in 2008 a $168 billion stimulus (tax rebate checks) was enacted under President Bush. In 2009, President Obama’s American Recovery and Reinvestment Act injected about $831 billion over several years into infrastructure, aid to states, and tax credits. While these packages cushioned the downturn and helped the recovery, they also added to short-term deficits. Economists debate their long-term impact, but CBO analyses suggest ARRA raised GDP and employment significantly in the years immediately after the recession at the cost of higher debt. In the 2020 COVID crisis, stimulus reached unprecedented scale: the CARES Act ($2.2 trillion) and follow-up legislation (about $900 billion in late 2020 and $1.9 trillion in early 2021 under the American Rescue Plan) together totaled over $5 trillion in pandemic relief. This included direct payments to individuals, enhanced unemployment benefits, forgivable small business loans (the PPP program), industry-specific bailouts (e.g. airlines), and funding for vaccine development and distribution. The result was a rapid recovery — but also the largest two-year debt increase in U.S. history.
Other Notable Bailouts: In addition to these big episodes, the U.S. government has intervened in various specific crises. In 1975, it lent money to prevent New York City from bankruptcy. In 1979, it guaranteed loans to Chrysler Corporation to save it from collapse (Chrysler recovered and repaid those loans early). During the 1980s Savings & Loan crisis, hundreds of small banks failed; the government created the Resolution Trust Corporation (RTC) to take over bad assets at a cost of around $125 billion to taxpayers. After the 9/11 attacks in 2001, Congress provided ~$15 billion in aid to bail out the airline industry which was reeling from the sudden stop in air travel. More recently, in March 2023, after the failure of Silicon Valley Bank and others, regulators invoked a “systemic risk exception” to protect all depositors (even those above FDIC insurance limits) to prevent bank runs — effectively a de facto bailout of uninsured depositors, funded by the banking industry (and potentially indirectly by taxpayers). These instances show a pattern: when the stability of a major industry or the broader economy is at stake, the U.S. government often opts to intervene with financial support.
While bailouts and interventions can stabilize the economy in the short run, they often socialize losses (transferring private sector debts or risks onto the public balance sheet). Each major intervention since 2000 — the post-9/11 aid, TARP, COVID relief, etc. — added to the national debt. Furthermore, the expectation of government rescue may encourage excessive risk-taking (the moral hazard problem). Nevertheless, most economists agree that without these measures, the crises would have been far worse and more costly. The challenge going forward is that repeated interventions have left the government with a significantly higher debt load and potentially fewer options for the next crisis.
Debt Accumulation and the “Current Crisis”
All of the above factors — fiscal policy choices, economic shocks, and interventions — have contributed to the growth of the U.S. national debt, which now stands at record levels. The gross federal debt of the United States exceeds $33 trillion (as of early 2025), more than 120% of the nation’s annual GDP. To put this in perspective, the debt-to-GDP ratio is now higher than it was in 1946 after WWII. The post-war debt was gradually worked down (to ~24% of GDP in 1974) (The U.S. National Debt Dilemma | Council on Foreign Relations), but since the 1980s the trend has been upward. Major inflection points include the 1980s deficits, the early 2000s (when debt held by the public rose from 31% of GDP in 2001 to 39% in 2005 due to tax cuts and war spending), the Great Recession (debt jumped from ~35% to ~70% of GDP by 2012) and the COVID pandemic (debt jumped roughly from 79% to 97% of GDP from 2019 to 2021 (Federal Budget Outlook — How did the fiscal response to the COVID …) (The U.S. National Debt Dilemma | Council on Foreign Relations)). Today, debt is rising faster than the economy, even in good years. In FY2023, for example, the federal deficit was about 7.8% of GDP (in a time of low unemployment and solid growth) — an unusually large gap outside of war or recession (The U.S. National Debt Dilemma | Council on Foreign Relations). This implies the debt will continue climbing relative to GDP absent policy changes.
A key consequence of high debt is the cost of servicing it. As interest rates climb from their near-zero lows, the U.S. is spending much more on interest payments. In FY2023, net interest on the debt was $659 billion (about 2.5% of GDP) (The U.S. National Debt Dilemma | Council on Foreign Relations) — roughly equal to the entire federal budget for Medicaid, and more than the budgets of the Departments of Defense or Education. The CBO projects that, with interest rates normalized and debt still growing, interest costs will triple to around 7.5% of GDP in 30 years (The U.S. National Debt Dilemma | Council on Foreign Relations) if current policies persist. This creates a dangerous feedback loop: the government must borrow to pay interest on past borrowing, pushing debt ever higher. Notably, investor Ray Dalio has warned the U.S. could enter a “debt spiral,” where it has to issue increasing debt just to service existing debt, until investors lose confidence (Ray Dalio Says US Government Approaching ‘Debt Death Spiral’ — Bitcoinsensus.PDF). In Dalio’s words, it’s like “when the debtor needs to borrow money to pay debt service, and it accelerates… everyone sees that and they don’t want to hold the debt” (Ray Dalio Says US Government Approaching ‘Debt Death Spiral’ — Bitcoinsensus.PDF). Such a scenario could lead to a rapid fiscal crisis, as happened in some other countries (more on that below).
What makes the current debt situation especially concerning is that unlike in the past, the debt is structural rather than cyclical. In boom times (like the late 2010s), the U.S. still ran large deficits, which is historically unusual. As baby boomers retire in greater numbers, Social Security outlays are exceeding payroll tax revenues, and Medicare costs are exploding due to rising healthcare prices and an aging population (The U.S. National Debt Dilemma | Council on Foreign Relations). These trends mean deficits are “built in” to the federal budget even at full employment. Moreover, political polarization has made it difficult to enact long-term deficit reduction. Episodes like the 2011 debt-ceiling standoff and government shutdowns highlight the challenges in simply keeping government funded, let alone agreeing on debt reduction. Credit rating agencies have taken notice — in 2011, S&P downgraded the U.S. credit rating from AAA to AA+ amid political gridlock over the debt ceiling. As of 2023, U.S. debt remains highly rated and U.S. Treasury securities are still seen as a global safe asset, but the margin for error is shrinking.
Despite these alarms, some context is important. The U.S. has some unique advantages that mitigate the risk of a classic debt crisis. First, the dollar is the world’s reserve currency, and U.S. Treasury bonds are widely held as a top safe asset (The U.S. National Debt Dilemma | Council on Foreign Relations). This means there is usually strong demand for U.S. debt, keeping borrowing costs lower than they otherwise might be (investors worldwide trust the U.S. to honor its obligations). Second, the U.S. controls its own currency and can never be forced by creditors to default — in theory, it can always print dollars to meet debt payments (though at risk of inflation). Third, a significant portion of U.S. debt is held by domestic institutions, including the Federal Reserve itself (the Fed holds roughly $5 trillion of Treasurys as of 2023). In fact, in Japan (which has far higher debt-to-GDP), the central bank holds debt equal to 100% of GDP, effectively owing money to itself (Japan has ways to avoid a sovereign debt crunch | Reuters). By some measures of net debt, the U.S. government’s net liability is smaller than the gross $33 trillion figure, because it also holds large assets and many debts are owed internally. For example, when accounting for federal assets and the Fed’s holdings, Japan’s net debt is around 119% of GDP — “on this basis, Japan has the same level of indebtedness as the United States” (Japan has ways to avoid a sovereign debt crunch | Reuters), suggesting the U.S. net debt is similarly around 100–120% of GDP.
Even so, the risks of long-term deficit spending are real. High debt can crowd out private investment (investors buying government bonds may invest less in productive capital), potentially slowing economic growth. It also limits the government’s flexibility to respond to future crises — when debt is already high, massively ramping up borrowing (as in 2020) is more fraught and could spook markets. Perhaps the greatest risk is that at some point, investors could demand much higher interest rates to continue lending to the U.S. or could shift out of dollar assets, which would make financing the debt far more expensive and possibly destabilize the dollar’s value. So far, there is little sign of such a sudden flight — Treasury auctions still see robust demand, and during global turmoil investors often flee to the U.S. dollar and bonds as a safe haven. But sentiment can change. As one budget expert put it, “the debt doesn’t matter until it does” (The U.S. National Debt Dilemma | Council on Foreign Relations) — meaning everything seems fine until a tipping point is reached. No one knows exactly where that point is, but the U.S. is arguably inching closer to it as debt grows. In sum, the current financial situation is characterized by record debt and rising interest burdens, which, while not an acute crisis yet, constitute a slow-burning problem that could crescendo into a larger emergency if not addressed.
Comparisons to Other Economic Collapses
History offers cautionary tales of what can happen if debt and inflation spiral out of control. While the U.S. has unique strengths, it’s useful to compare its trajectory with other countries that experienced severe economic crises:
Weimar Germany (1920s) — After World War I, Germany faced enormous reparations debt and began printing money to pay its bills. The result was hyperinflation: by January 1923, 1 U.S. dollar cost 17,000 German marks; by December 1923, it cost 4.2 trillion marks (How Hyperinflation Heralded the Fall of German Democracy | Smithsonian). Prices were doubling every few days, and the currency became virtually worthless. This collapse of financial stability destroyed savings and helped fuel social unrest that destabilized the government. The U.S. is nowhere near a Weimar scenario — hyperinflation is above 50% per month, whereas even recent U.S. high inflation was ~9% per year. The Fed is also far more independent and committed to price stability than Germany’s Reichsbank was. However, Weimar illustrates the extreme endgame of unchecked money printing to finance government deficits. It’s a reminder that confidence in a currency can evaporate if a nation’s debt seems unpayable except by debasing the currency.
Argentina — Argentina has defaulted on its sovereign debt nine times since independence and suffered episodes of hyperinflation (inflation exceeded 5,000% in 1989 during one of its worst crises) (Economic history of Argentina — Wikipedia) (Three to Tango: Argentina, IMF, and Debt — The SAIS Review of International Affairs). Chronic overspending, political instability, and reliance on foreign-currency debt have plagued Argentina. In 2001, it defaulted on ~$100 billion, devastating its economy. Typically, Argentina’s crises involve a collapsing currency, runaway inflation, and forced austerity as external credit is cut off. By contrast, U.S. debt is in its own currency, and the U.S. has never defaulted — factors which greatly reduce default risk. However, one parallel is worth noting: Argentina’s government often tried to delay hard choices by borrowing more, until lenders lost patience. Similarly, the U.S. government’s current plan (or lack thereof) essentially relies on investors’ continued willingness to finance its deficits indefinitely. While the U.S. is a far cry from Argentina’s situation — it has a much larger and more diversified economy and unparalleled access to credit — the Argentine example shows how repeated deficit spending without structural fixes can lead to currency crisis and collapse in living standards. Sustained high inflation is another parallel: Argentina’s inflation often runs in double or triple digits; the U.S. currently is in single digits, but a failure to control inflation now could potentially start moving in the wrong direction. The key difference is institutional credibility — the U.S. has a much stronger central bank and rule of law, which so far have preserved confidence.
Greece — Greece’s sovereign debt crisis in the early 2010s is a more recent cautionary tale. By 2009, Greece had a debt-to-GDP ratio around 130%, and it was revealed that the government had underreported deficits. Investors panicked, and Greek bond yields spiked, making it impossible for Greece to borrow at sustainable rates. Despite rescue packages, debt rose to about 180% of GDP by 2014 as the economy contracted under austerity (The Greek Debt Crisis: No Easy Way Out). Ultimately, Greece needed multiple bailouts from the International Monetary Fund and European Union (totaling over €240 billion) and imposed harsh austerity measures — cutting pensions, raising taxes, and reducing public employment. The economy shrank by 25%, and unemployment exceeded 25% at peak. The U.S. differs from Greece in critical ways: the U.S. borrows in its own currency and can issue debt freely, whereas Greece is in the Eurozone and cannot print euros. The U.S. also has a much deeper domestic capital market. However, the Greek crisis demonstrates the risk of investor sentiment turning against a heavily indebted country. Once markets doubt a country’s fiscal sustainability, borrowing costs can skyrocket and a self-fulfilling crisis unfolds. The U.S. has the advantage that Treasurys are a global benchmark for safety — but if U.S. fiscal ratios keep deteriorating, ratings could be cut further and investors might demand higher yields. A Greek-style sudden stop is unlikely for the U.S. (given the Fed’s ability to be lender of last resort in dollars), but the U.S. could face something akin to it in a political crisis — for instance, a debt ceiling impasse that leads to technical default could shock the system in a way reminiscent of Greece, even if the economics differ.
Japan — Japan is an interesting comparison because it shows a case of extremely high debt without crisis, but at the cost of economic stagnation. Japan’s gross government debt is over 250% of GDP — the highest in the developed world (Japan has ways to avoid a sovereign debt crunch | Reuters). Yet Japan has not defaulted nor experienced high inflation. Instead, Japan endured what’s known as the “Lost Decades” after its early-1990s asset bubble burst. Its economy had minimal growth and periods of deflation (falling prices). To support the economy, the Japanese government ran deficits year after year, and the Bank of Japan kept interest rates near zero, even engaging in its own QE. As a result, Japan’s interest costs remained manageable despite the huge debt — bond yields stayed around 0% as the central bank became the major buyer of government bonds. The Japanese public also holds a lot of the debt, and there’s a cultural norm to save, which helped. By some measures, Japan’s strategy “worked” insofar as there was no default or hyperinflation. But the price was economic stagnation — GDP today is only slightly higher than in the early 1990s, and the society has had to adapt to lower expectations. For the U.S., Japan’s experience suggests one possible path: if the Fed were to keep interest rates very low and tolerate more inflation, the U.S. might sustain higher debt without a default, but growth could be anaemic and living standards might stagnate. That said, there are differences: Japan’s debt is largely domestic, while a significant share (~30%) of U.S. debt is held by foreign investors (The U.S. National Debt Dilemma | Council on Foreign Relations) (notably China and Japan themselves). Additionally, Japan’s population is shrinking, which contributed to low growth, whereas the U.S. population (thanks to immigration) is still growing slowly. Japan’s precedent shows that high debt need not cause an immediate crisis, but it can act as a drag on the economy for generations. It also relies on unusual conditions (like very low interest rates and central bank intervention) that may not hold indefinitely. In fact, as of 2023, even Japan is facing pressure — inflation has ticked up there and the central bank may need to raise rates, which would test its debt sustainability.
In summary, comparisons show a spectrum of outcomes: hyperinflation and collapse (Weimar, worst-case Argentina), sovereign default and forced austerity (Greece, Argentina 2001), or long-term stagnation under heavy debt (Japan). The United States today does not mirror any one case perfectly. It has a far larger and more dynamic economy than Greece, far stronger institutions than historical Argentina or Weimar Germany, and more inflationary pressure (and less social cohesion around austerity) than Japan. The U.S. likely won’t face a sudden collapse unless mismanagement (like failing to raise the debt ceiling) triggers a self-inflicted crisis. Instead, the danger is a slow erosion — either via inflation eating away at real savings (a controlled version of the Weimar route) or via sluggish growth and rising interest burdens (the Japan route). The goal of U.S. policy will be to avoid both extremes by putting the debt on a stable path before a crisis occurs.
Policy Evaluations & Potential Solutions
Addressing the United States’ fiscal and financial challenges will require tough policy choices. Experts across the political spectrum generally agree that stabilizing debt will involve some combination of spending reductions and revenue increases, phased in over time to minimize economic disruption (The U.S. National Debt Dilemma | Council on Foreign Relations) (The U.S. National Debt Dilemma | Council on Foreign Relations). There is also a role for monetary policy (to curb inflation) and structural economic reforms (to boost growth). Below are key proposed solutions and considerations:
Spending Cuts (Especially Entitlements and Defense): Given that the largest and fastest-growing parts of the budget are entitlement programs, many plans call for reforming these to slow their cost growth. For example, the bipartisan 2010 Simpson-Bowles Commission recommended measures like gradually raising the Social Security retirement age, adopting more progressive indexing of benefits, and cutting some benefits for higher-income retirees (The U.S. National Debt Dilemma | Council on Foreign Relations). It also suggested restraining Medicare and Medicaid spending (through cost-sharing or payment reforms) and reducing discretionary spending including defense (The U.S. National Debt Dilemma | Council on Foreign Relations). In fact, Simpson-Bowles would have reduced overall spending to ~21% of GDP by 2022 (from a projected 24%+) and put debt on a downward path (The U.S. National Debt Dilemma | Council on Foreign Relations). Other proposals include imposing spending caps or a “trigger” that enforces automatic cuts if deficits exceed certain targets. However, cutting popular programs is politically difficult — retirees are a powerful voting bloc defending Social Security and Medicare, and lawmakers are reluctant to slash defense due to security concerns and domestic jobs tied to military contracts. Nonetheless, without curbing entitlements, it is almost impossible to fix the debt because Social Security and healthcare entitlements alone are projected to drive much of the future deficit (The U.S. National Debt Dilemma | Council on Foreign Relations). Even defense, which is over $750 billion/year, could be scrutinized for savings (e.g. reducing overseas military deployments or cutting outdated weapons programs). Care must be taken that spending cuts are gradual and strategic so as not to tip the economy into recession or harm vulnerable groups.
Tax Reforms and Increases: On the revenue side, most deficit-reduction plans also involve raising tax revenue above its historical average (~17% of GDP) to perhaps 19–20% of GDP. This can be done in ways that minimize economic harm. Options include broadening the tax base by closing loopholes and deductions (for instance, limiting deductions for mortgage interest or state taxes, which primarily benefit higher earners), raising tax rates on high incomes or corporate profits, or introducing new taxes such as a carbon tax or a national value-added tax (VAT). Simpson-Bowles, for instance, proposed simplifying the tax code (eliminating many tax expenditures) while slightly lowering marginal rates, which would net more revenue overall; it aimed to raise over $1 trillion in new revenue over a decade (The U.S. National Debt Dilemma | Council on Foreign Relations). Another example is letting some of the recent tax cuts expire or adjusting capital gains taxes to reduce preferential treatment. The challenge to raising revenue is largely political: many elected officials, especially Republicans, have taken a “no new taxes” stance (The U.S. National Debt Dilemma | Council on Foreign Relations). However, economists note that the total U.S. tax burden as a share of GDP is low relative to other advanced countries, so there may be room to increase revenues without undercutting competitiveness — especially if done through broad-based consumption taxes or carbon fees that also yield social benefits (like reducing pollution). Comprehensive tax reform could also enhance economic efficiency, potentially boosting growth (for example, by removing distortions in how investments are taxed). Ultimately, a likely solution is a mix of spending cuts and tax hikes — for example, a future budget deal might trim entitlement growth and defense spending and also implement a surtax or VAT. Such compromise is painful but was achieved in the past (e.g., the 1990 and 1993 deficit reduction packages). Without action, the government may eventually be forced into much more draconian cuts or steep taxes under crisis conditions, which is what experts urge the U.S. to avoid by acting sooner.
Monetary Tightening and Inflation Control: The Federal Reserve’s role in the solution is indirect but crucial. By raising interest rates and normalizing monetary policy, the Fed is tackling the inflation that erupted after the pandemic. Controlling inflation is important because high inflation undermines fiscal stability — it raises government costs (TIPS payouts, COLA adjustments on benefits) and can erode public confidence, and if unchecked it might tempt the government to finance itself via money creation (a slippery slope to a Weimar scenario). The Fed’s current tightening is bringing down inflation, but it also makes government borrowing more expensive. There is a delicate balance: moderately higher inflation could, in theory, help shrink the debt-to-GDP ratio (by boosting nominal GDP) — indeed, some economists suggest accepting say 4% inflation for a while as a way to ease debt burdens. However, the Fed’s mandate is price stability, and allowing inflation to run too high carries its own risks (as seen in the 1970s). Thus, the better path is to pair Fed tightening (to restore low inflation) with fiscal adjustments (to reduce deficits). If the Fed alone tightens while fiscal policy remains loose, it’s like pressing the gas and brakes at the same time in economic policy — interest costs surge and could nullify the effect of any deficit reduction. On the other hand, if fiscal policy tightens (through spending cuts/taxes), it can allow the Fed to not raise rates as much, easing the interest burden. In summary, policy coordination is key: fiscal authorities need to create a sustainable budget path, and the Fed needs to maintain credibility on inflation. A stable macro environment with low inflation and steady growth will make it easier politically to implement debt solutions (as opposed to doing so in a crisis atmosphere).
Structural Reforms and Growth Initiatives: Another avenue is making the economy grow faster, which would improve the debt ratio. Policies that enhance productivity and labor force growth can help: for example, investments in infrastructure, education, and R&D that have high returns could expand GDP in the long run (though they may cost money upfront). Immigration reform to attract younger skilled workers could expand the tax base and alleviate demographic pressures. Regulatory reforms that stimulate entrepreneurship and innovation can also contribute. The idea is that a bigger economic pie makes debts and deficits more manageable (as seen after WWII, when high growth effectively “outgrew” the debt). Of course, these measures are not substitutes for fiscal discipline, but they can make the required adjustments less painful by boosting revenues naturally. Healthcare reform is particularly relevant — since Medicare and Medicaid are big drivers of future debt, finding ways to bend the curve of healthcare cost inflation (for instance, through price negotiations for drugs or delivery system reforms) would significantly improve the fiscal outlook over time.
Alternate Strategies: Some economists from the Modern Monetary Theory (MMT) school argue that the U.S. can sustain much higher debt without ill effects as long as inflation is under control. They suggest deficits are not inherently bad and that the government can always create money to finance spending until inflation becomes a problem. The recent surge in inflation, however, has cast doubt on the no-consequences view of deficit financing. It revealed that real resource constraints do exist. Another strategy that is sometimes mentioned is a debt ceiling reform or repeal — while not a solution to debt per se, removing the threat of default via the debt ceiling could at least avoid self-inflicted crises and allow more rational budgeting (The U.S. National Debt Dilemma | Council on Foreign Relations). There’s also talk of mechanisms like the debt-to-GDP targeting (commit to policies that adjust automatically to hit a certain debt ratio in the future) or even more exotic ideas like coin seigniorage (the infamous “trillion-dollar coin” concept to technically pay down Fed-held debt) — but these are largely accounting gimmicks or emergency tools, not long-term solutions.
In evaluating policy options, it’s clear no single measure will suffice; a comprehensive approach is needed. A credible plan would likely involve something akin to a modern Simpson-Bowles: cut discretionary spending waste, reform entitlements for long-term savings, raise revenue through a fairer tax code, and perhaps implement budget rules to enforce discipline. Importantly, any plan should be phased in gradually to avoid derailing the economy — for example, entitlement changes often protect current retirees and phase changes over decades, and tax increases can be scheduled when the economy is strong. The sooner such a plan is enacted, the gentler the adjustments can be (because compounding will be less severe). Waiting until markets demand adjustment (or a crisis forces it) would mean far more abrupt and painful measures.
It’s worth noting that some renowned economists argue the U.S. should not overreact to high debt in panic. They point out that as long as interest rates remain below growth rates, the debt can be rolled over sustainably. For instance, former Treasury Secretary Larry Summers and Jason Furman have suggested that investing in America’s future (infrastructure, education, etc.) is more important than arbitrary debt targets, and that a focus on deficit reduction amid certain conditions could be misguided — essentially, don’t obsess over the debt at the expense of growth (The U.S. National Debt Dilemma | Council on Foreign Relations). Similarly, Olivier Blanchard (former IMF chief economist) has noted that high debt is not imminently catastrophic and that a gradual reduction of deficits, not sudden austerity, is the prudent course (The U.S. National Debt Dilemma | Council on Foreign Relations). These perspectives remind policymakers that context matters — if interest rates on government debt stay low (relative to growth) and the U.S. maintains credibility, the nation has time to fix its finances without panic.
In conclusion, the United States reached its current financial state through decades of policy decisions: fighting wars and recessions with borrowed money, expanding social programs without fully paying for them, and at times benefiting from — but ultimately relying too much on — cheap credit. The broad economic history from post-WWII prosperity, through stagflation, through globalization and financial boom-bust cycles, shows that each era left its imprint on the national ledger. The role of fiscal policy has been pivotal — tax cuts and spending increases have often been more politically appealing than the reverse, leading to chronic deficits. Monetary policy enabled this to some extent by keeping interest costs low for a long time, though it now faces the task of reining in inflation. Major crises forced the government to intervene heavily (from the 1970s oil shock to 2008 to 2020), each time adding to the debt in order to save the economy. All these threads have converged in the 2020s: the U.S. enjoys unparalleled economic strength and the dollar’s dominance, yet it carries a debt load that is historically high and rising, raising legitimate worries about the future. The U.S. has not yet faced a day of reckoning — and with wise policy, it may never face a sudden collapse like other nations have. But to ensure that, leaders will eventually need to implement a mix of spending restraint, tax reform, and growth-oriented policies. In essence, the sooner the U.S. addresses the root causes of its deficits, the better its chances of steering toward a sustainable financial course and avoiding the fate of those who waited until it was too late (The U.S. National Debt Dilemma | Council on Foreign Relations). The path forward is challenging, but history (and many expert analyses) suggest that a balanced, comprehensive approach can restore stability and preserve America’s economic leadership for the long run.
Sources: The analysis above is based on historical data and reports from the U.S. Federal Reserve, Congressional Budget Office, Council on Foreign Relations, and other economic research (Post–World War II economic expansion — Wikipedia) (The U.S. National Debt Dilemma | Council on Foreign Relations) (The U.S. National Debt Dilemma | Council on Foreign Relations) (The U.S. National Debt Dilemma | Council on Foreign Relations) (The U.S. National Debt Dilemma | Council on Foreign Relations), as well as lessons drawn from international cases (How Hyperinflation Heralded the Fall of German Democracy | Smithsonian) (Economic history of Argentina — Wikipedia) (The Greek Debt Crisis: No Easy Way Out) (Japan has ways to avoid a sovereign debt crunch | Reuters). These sources provide a factual foundation for understanding how past policies and events have led to the current U.S. financial situation and what potential solutions and risks lie ahead.
